Main Window
Signal Search Tree
Users can select the desired block from the SST tree hierarchy. Then the signal direction and type information may be displayed in the lower portion of the SST section as shown
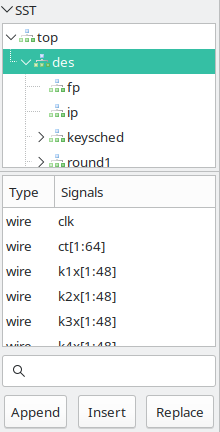
The Signal Search Tree
After that Drag and Drop the signals from the lower portion of the SST into the “Signals” section to import traces.
In addition. To filter signals based on
the I/O port direction, prefix the search regular expression with
specific case-insensitive identifiers: +I+ for inputs, +IO+ for
input/output, +O+ for outputs, +L+ for linkage (in VHDL), and +B+ for
buffers (in VHDL). Negative matching filters are also available,where --
only displays I/O ports, -I- excludes inputs, and -O- excludes outputs.
Conversely, ++ excludes all I/O ports.
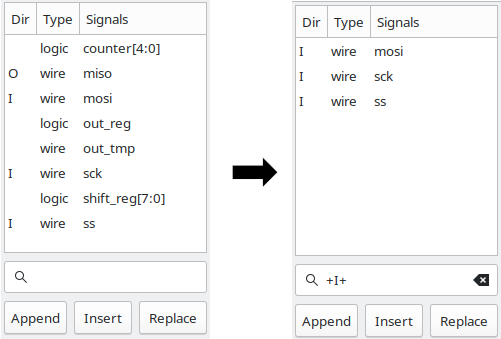
I/O and type information in SST frame with / without filter
Depending on the capabilities of the file format loaded into GTKWave, the SST frame/window may also depict the type of hierarchy being shown. The figures below are representative of FST.
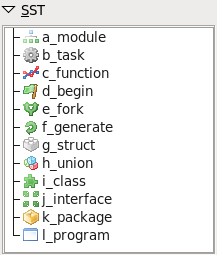
Verilog hierarchy type icons in SST frame
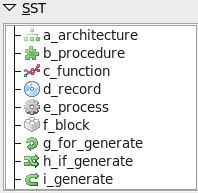
VHDL (not GHDL) hierarchy type icons in SST frame
Signals Frame
Signals frame with scrollbar
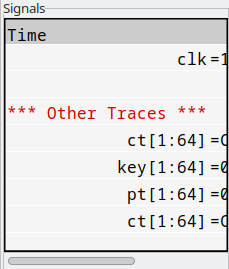
The signal frame is nothing more than a list of signals,
optional comments, and optional blank lines. The following is a
sample view of the signal frame showing a highlighted trace clk
and a comment trace, *** Other Traces ***. In between the two is a
blank trace inserted by the user. Note that the highlighting of a trace
can be achieved by clicking the left mouse button on an entry in the
signal frame. (Use Control+Click to deselect.)
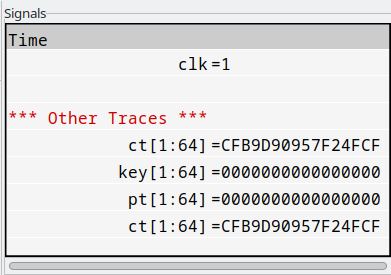
You will notice that the scrollbar along the bottom of the frame indicates that there is a hidden section to the right. This hidden area contains the values of the signals, any time the primary marker is nailed down. The scrollbar can be manually moved to show this area or the pane to the right of the signal frame can be enlarged to allow full viewing of the frame.
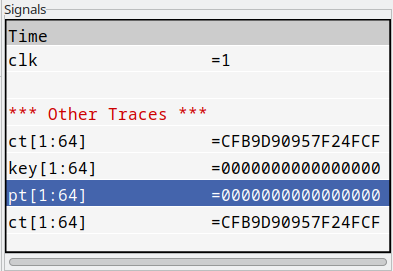
Signals frame with no hidden area from left to right
As seen above, the signal names are right justified and are flush against the equals signs. This is only a matter of personal preference, and if desired, the signals can be left justified against the left margin of the signals frame by pressing the key combination of Shift+Home. This is useful for detection hierarchy differences for different net names. Press Shift+End to right justify the signal names. (Right justification is the default behavior). Regardless of the state of signal name justification, the signal values are left justified against the equal sign and cannot be moved.
Signals frame with left justified signal names
Note that the signals frame supports a form of self-contained Drag and Drop such that the right mouse button can be used to harvest all the highlighted traces in the window. By holding the right button and moving the mouse up and down, a destination for the traces can be selected. When the mouse button is released, the traces are dropped at the trace following the one the mouse pointer is pointing to.
Multiple traces can be selected by marking the first trace to highlight, move the cursor to the destination trace, and Shift+Click with the left mouse button. All the traces between the two will highlight or unhighlight accordingly. To highlight all the traces in the signal frame, Alt+H can be pressed. To unhighlight them, also press the Shift key in conjunction with Alt-H. (This can also be achieved by clocking on Highlight All or Unhighlight All in the Edit menu.)
Highlighting or unhighlighting traces by entering regular expressions will be covered in the menu section.
In addition, the scroll wheel will scroll the traces up and down when the signals frame has input focus.
Wave Frame
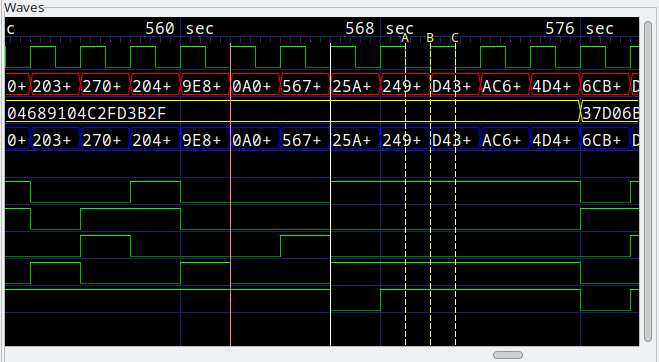
A typical view of the wave frame
The wave frame reformats simulation data into a visual format similar to that seen for digital storage scopes. The wave frame contains two scrollbars and a viewing area.
The scrollbar on the right controls not only the wave frame, but the signals frame in lockstep as well. The scrollbar on the bottom is used to scroll the simulation data with respect to the timescale that is shown on the top line of the wave frame.
The simulation data itself is shown as a horizontal series of traces. Values for multi-bit signals can be displayed in varying numeric bases such as binary, octal, hexadecimal, decimal, and ASCII. Values for single-bit traces are shown as “high” for zero and “low” for one, “z” (middle), and “x” (filled-in box). VHDL values are represented in a similar fashion but with different colors. The signals frame can always be used to verify the value of a value. So don’t be too concerned right now if you are not sure of what the single-bit representation of a signal looks like or are not sure if you can remember.
Two functional markers are available: the primary marker (red, use left mouse button to drop) which the signal window uses as its pointer for value data, and the baseline marker (white, use middle mouse button to drop) which is used to perform time measurements with respect to the primary marker. Twenty-six lettered markers “A” through “Z” (dropped or collected through menu options) are provided to the user as convenience markers for indexing various points of interest in a simulation.
The primary marker can also be used to navigate with respect to time. It can be dropped with the right mouse button and dragged to “open” up a region for zooming in closer or out farther in time. It can also be used to scroll by holding down the left mouse button and dragging the mouse outside the signals frame. The simulation data outside the window will then scroll into view with the scrolling being in the opposite direction that the primary marker is “pulling” outside the frame.
Trace data in the signals frame can also be timeshifted as shown below. To timeshift a trace, highlight the trace in the signal window the move over to the wave frame and then hold down the left mouse button to set the primary marker. Press the Control key then move the primary marker left or right. When the timeshift is as desired, release the mouse button then release Control. If you do not wish to go through with the timeshift, release the Control key before releasing the left mouse button. The trace(s) will then spring back to their original pre-shifted position.
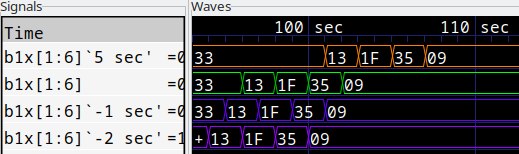
An example of both positively and negatively timeshifted traces
To achieve a finer level of granularity for timeshifting, menu options are available that allow the user to set specific values for a time shift. In this way, the pixel resolution of zoom is not the limiting factor in achieving an “exact” shift that suits a user’s needs.